Infographics: Visual Tools for Communication and Learning
What are Infographics?
Infographics are visual representations of information, data, or knowledge designed to present content quickly and clearly. By combining graphics—such as icons, illustrations, charts, and maps—with text, infographics tell a story, explain a concept, or demonstrate relationships between ideas. Their core purpose is to make information easier to understand, interpret, and remember.
Infographics are visual representations of information, data, or knowledge designed to present content quickly and clearly. By combining graphics—such as icons, illustrations, charts, and maps—with text, infographics tell a story, explain a concept, or demonstrate relationships between ideas. Their core purpose is to make information easier to understand, interpret, and remember.
In essence, an infographic is a powerful communication tool that leverages the human brain’s natural preference for visual information to convey messages more effectively. For educators, storytellers, and content creators, infographics serve as a way to simplify complex ideas, concepts, or processes. They provide a visual medium capable of illustrating interrelations among elements and possible paths of interaction. Even in printed form, infographics can express the essence of movement—suggesting action, reaction, and direction—while illuminating dynamic relationships among components.
Why Infographics Work
Infographics are especially valuable in educational settings, where they support learning and memory retention. Research has shown that infographics improve communication between users and digital interfaces, particularly in virtual environments (Rueda, 2015). Their strength lies in the brain’s ability to process images more quickly than text, making infographics an efficient way to deliver complex information.
Infographics are especially valuable in educational settings, where they support learning and memory retention. Research has shown that infographics improve communication between users and digital interfaces, particularly in virtual environments (Rueda, 2015). Their strength lies in the brain’s ability to process images more quickly than text, making infographics an efficient way to deliver complex information.
Several factors contribute to their effectiveness:
Visual Processing: The human brain processes visuals significantly faster than written language, enabling viewers to grasp content at a glance.
Memory Retention: Visual elements aid memory by creating stronger associations, making it more likely that the information will be remembered.
Engagement: Infographics draw attention and keep users interested, especially on social media or within digital educational platforms.
Simplification: Through hierarchy, color, and layout, infographics break down complex topics into digestible, structured parts.
When used in audiovisual content, infographics have also been found to support learning in specific academic subjects, such as Boolean algebra (Rueda, 2015). Additionally, their inclusion of images, symbols, and vibrant colors—paired with concise text—enhances comprehension and focus among learners (Mohd Noh et al., 2017). Studies have further shown that infographics contribute to the development of creativity, productivity, and critical thinking by fostering deeper understanding of complex information (Singh et al., 2022).

TheStoryLab simplifies complex ideas into simple steps.
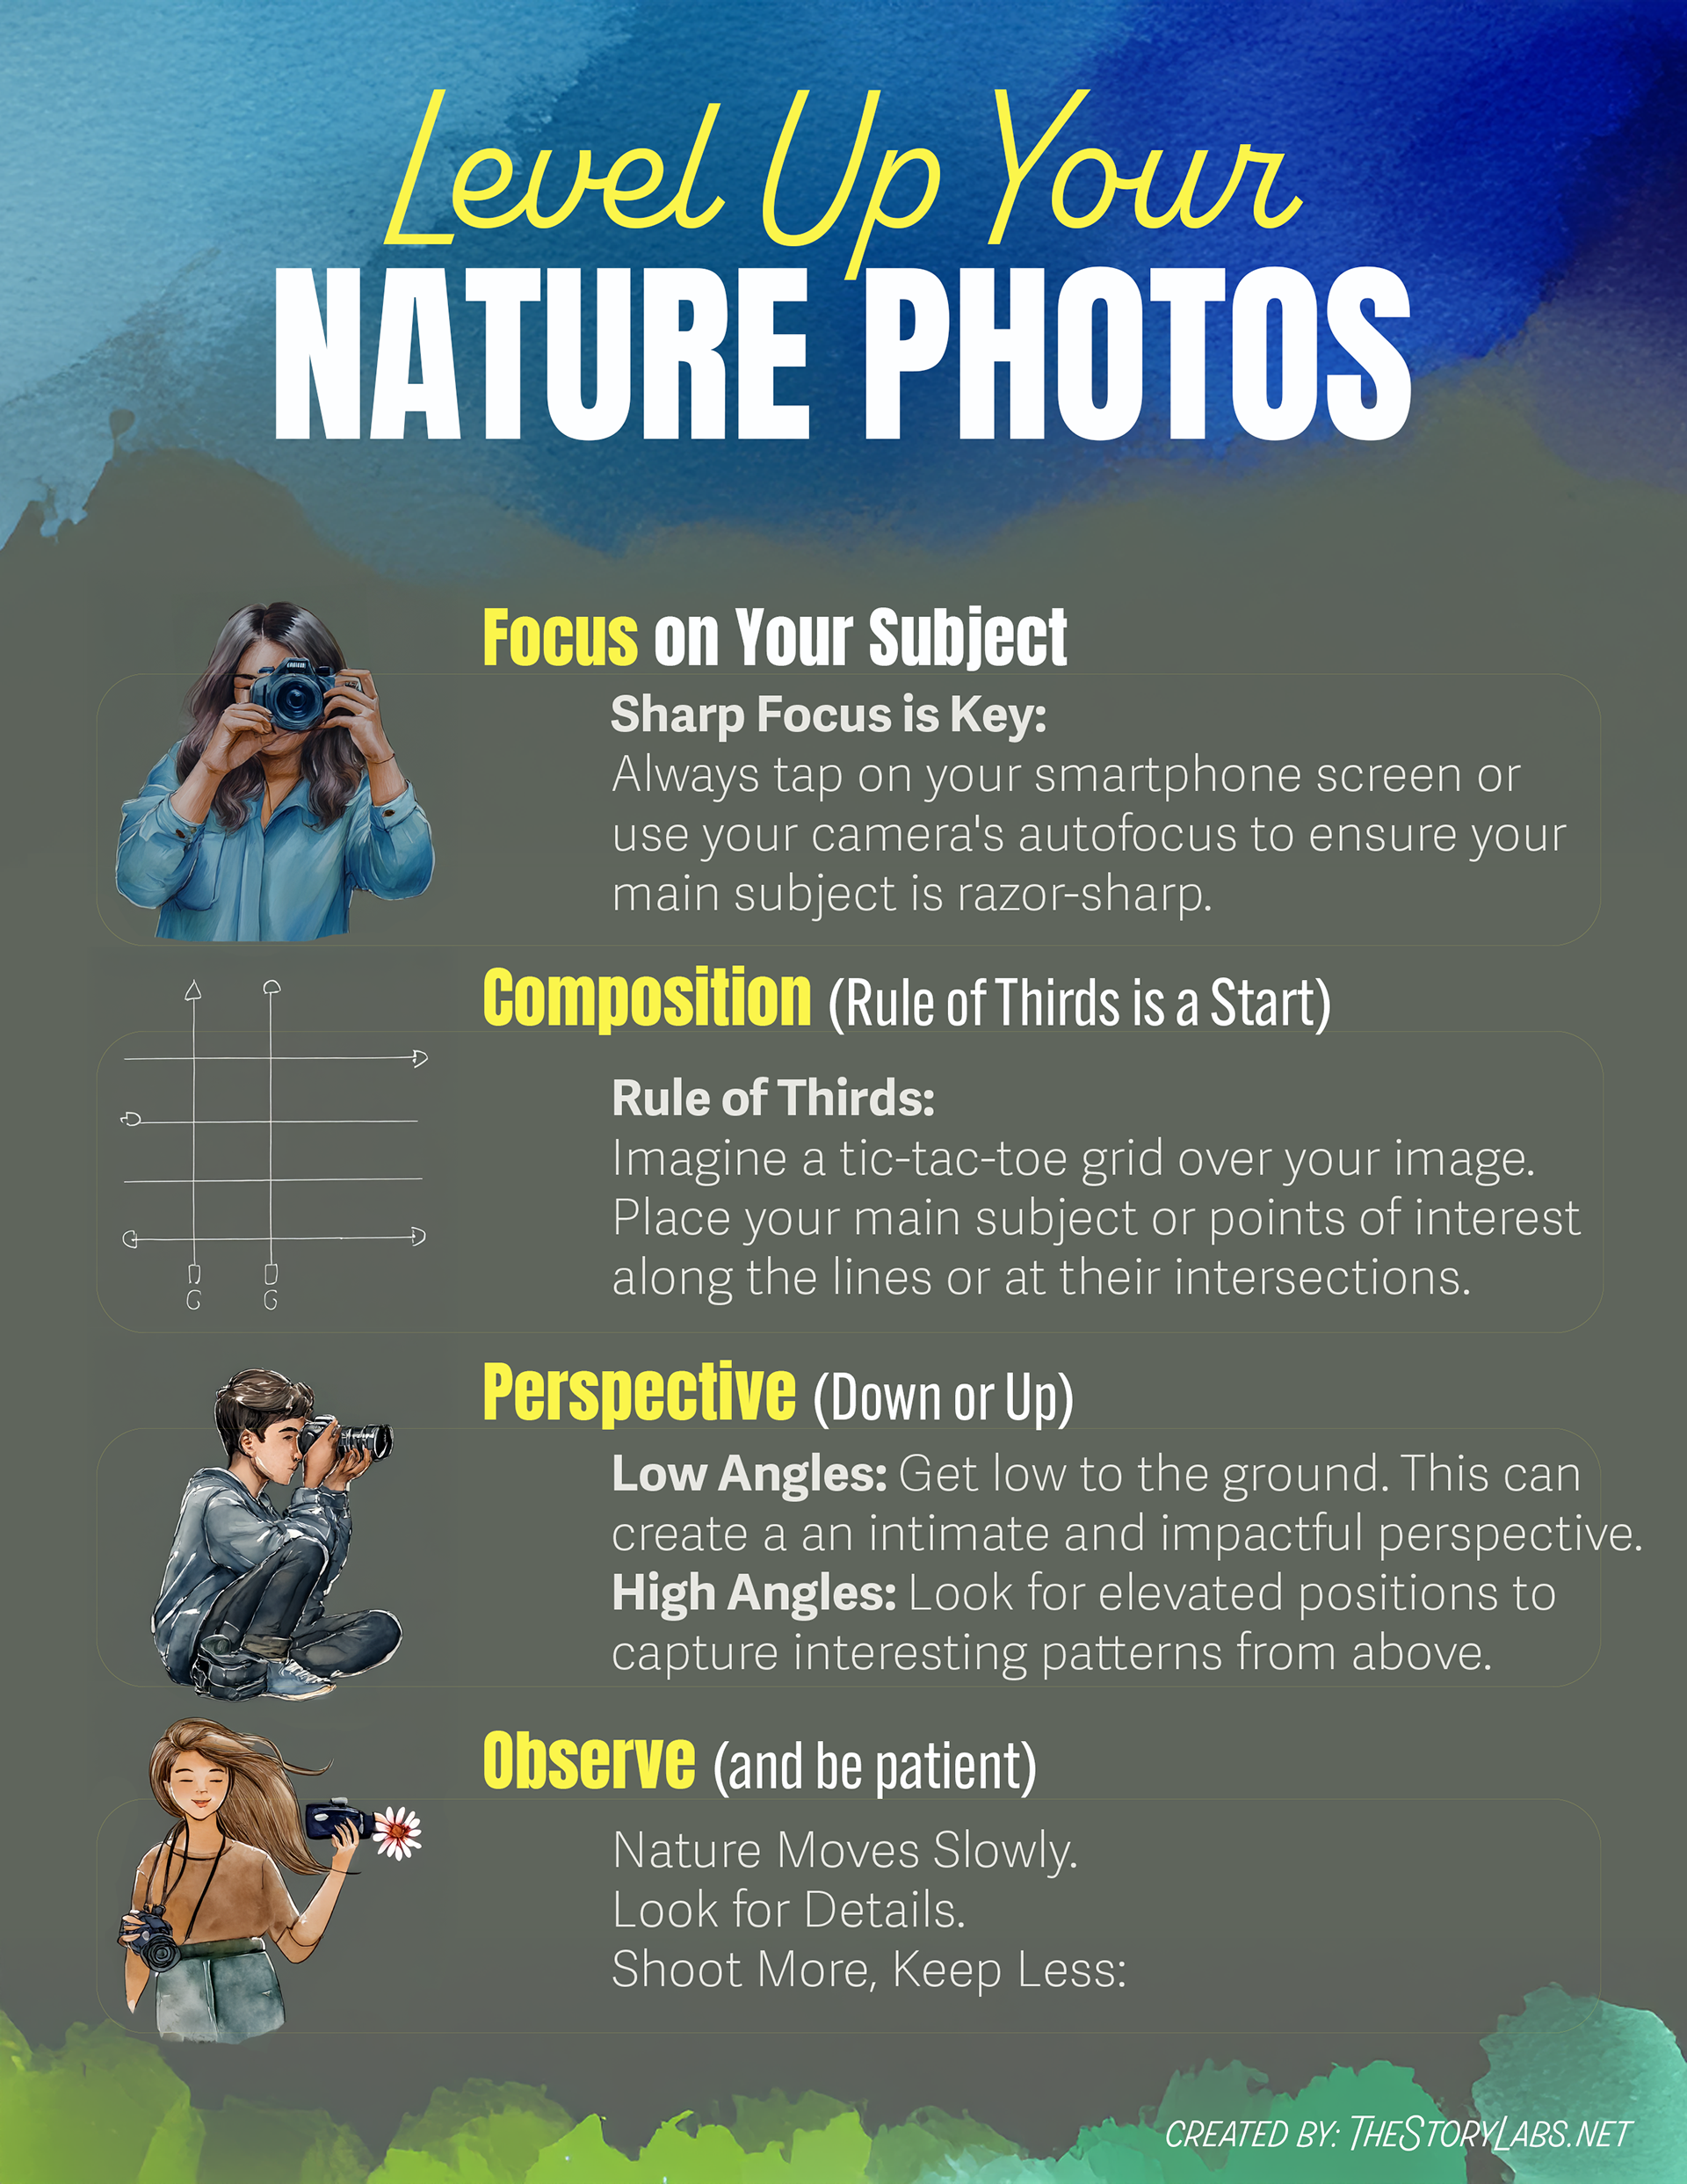
TheStoryLab uses an infographic in its Environmental Storytelling course.

Great stories start with curiosity.

Key Elements of Effective Infographics
Creating a successful infographic requires attention to several core design and content principles:
Creating a successful infographic requires attention to several core design and content principles:
- A Clear Focus: Each infographic should communicate one primary idea.
Visual Hierarchy: The layout must guide the viewer’s eye through the content in a logical flow.
- Consistent Design: Fonts, colors, icons, and graphic elements should be cohesive and aligned with the intended message.
- Accurate Content: All information must be well-researched, factual, and properly cited.
- Call to Action or Insight: Effective infographics conclude with a takeaway, question, or suggestion that encourages reflection or action.
Applications in Education and Storytelling
Infographics can play a valuable role in educational initiatives like the BeNative project by serving as effective visual tools that support learning and engagement. In courses, infographics can serve as visual guides, such as the “Story Spy” poster, which fosters curiosity and sensory observation while also helping to summarize the storytelling process, from concept development to final production. Additionally, they provide accessible visual checklists for tasks such as research planning and documentary production. By incorporating infographics into storytelling and learning activities, students are encouraged to see how meaning is shaped through both narrative structure and visual reasoning.

How to Spot Environmental Issues" is an infographic created for the BeNative project to inspire young nature detectives—Green Spies—to observe and identify environmental conditions in their local areas.
References
Mohd Noh, N., Yusof, R., Samah, N. A., & Ahmad, M. A. (2017). The impact of infographic design in enhancing learning process. Journal of Education and e-Learning Research, 4(2), 50–55.
Mohd Noh, N., Yusof, R., Samah, N. A., & Ahmad, M. A. (2017). The impact of infographic design in enhancing learning process. Journal of Education and e-Learning Research, 4(2), 50–55.
Rueda, R. R. (2015). Infographic as a communication tool in educational settings. Procedia - Social and Behavioral Sciences, 176, 282–289.
Singh, S., Bansal, P., & Sahu, S. (2022). Role of infographics in simplifying information and enhancing creativity. International Journal of Education and Development using ICT, 18(1), 120–134.